Corrected Log Mean Temperature Difference for Shell-and-Tube Heat Exchangers

This Excel spreadsheet calculates the corrected LMTD for shell-and-tube heat exchangers with multiple shell-side passes.


True log mean temperature differences are only valid in double-pipe (or tubular) heat exchangers; hence for more complex shell-and-tube arrangements, we have to muliply the LMTD by a factor.

The equations used in the spreadsheet are taken from the work of Bowman et al (1940) and are given below.
Note that R is the temperature change ratio of the hot and cold streams, while P is the temperature change of the cold fluid divided by the maximum temperature difference.  F is the LMTD correction factor.

Perrys Chemical Engineers' Handbook states LMTD correction factors lower than 0.8 indicate inefficient heat exchanger design, while the Heat Exchanger Design Handbook advises that the minimum value should be 0.75.

Download Excel spreadsheet to calculate Corrected Log Mean Temperature Difference

The IGT Distribution Equation for Natural Gas Flow

I've previously blogged on the Weymouth and Panhandle A & B equations to predict the flow of natural gas through pipelines. Today, I'll complete this series of posts by presenting an Excel spreadsheet that calculates the IGT Equation (also known as the IGT Distribution Equation) for the flow of natural gas. The equation is particularly suitable for high pressure, high flowrates through steel or plastic/polyethylene pipes.


This is the IGT Equation as implemented in the spreadsheet (notation is defined here)


The spreadsheet allows you to choose between several units, and takes care of all unit conversions behind the scenes. It also enables you to model the effect of elevation changes on flowrates.


The Panhandle A and B Equations for Natural Gas Flow

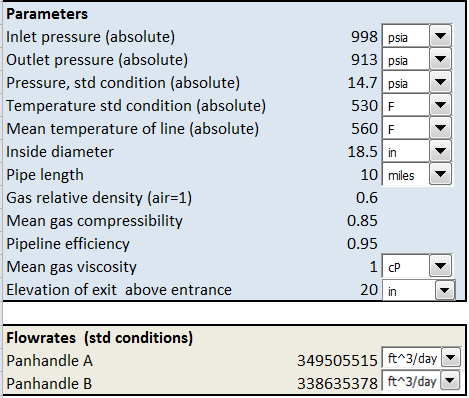
This Excel spreadsheet calculates the Panhandle A and B equations for the flow of natural gas through high pressure pipelines. You can choose between USCS (field units) or SI units, and even mix both (the spreadsheet does the unit conversion for you).


With Excel's Goal Seek function, you can also back-solve. For example, you can ask Excel to calculate the exit pressure that gives you a desired flowrate.

Weymouth (1912) developed the general gas flow equation. However, a limitation is that the friction factor can only be obtained iteratively. Hence simpler relationships based on the gas flow equation were developed, including the Weymouth equation and the Panhandle A (developed in the 1940s) and B (developed in 1956) equations.  These correlations simply substituted equations for the transmission factor (i.e. the friction factor) into the general gas flow equation.

The Panhandle equations are considered fairly accurate for Reynolds numbers between 4 million and 40 million.  Panhandle A is best suited for 12-60 inch diameter pipelines at pressures between 800 psia to 1500 psia. Panhandle B is most often used for pipes with a diameter of 36 inches or larger, and pressures above 1000 psia. Gas flows in pipelines with diameters of 15 inches or below are better modeled by the Weymouth equation.

As a caveat, the equations were originally developed for long pipelines; hence their use in shorter runs may not be appropriate

These are the equations implemented in the spreadsheet.


The notation is defined in a prior blog post that explores the Weymouth equation.

Download Excel spreadsheet for the Panhandle A and B equations for natural gas flow

The Weymouth Equation for High Pressure Gas Flow

This Excel spreadsheet helps you calculate pressures and flowrates using the the Weymouth Equation, a relationship usually used in long-distance natural gas pipelines.


The Weymouth Equation gives more conservative results than the Panhandle equations, and is hence more frequently used.  It is valid for steady-state adiabatic (isothermal) flow.  The version of the Weymouth equation used in this spreadsheet also accounts for elevation differences between the pipe entrance and exit.

In Imperial units, the Weymouth equation is

  • Tsc and Psc are the temperature and pressure at standard conditions, in absolute Fahrenheit
  • Tm is the average temperature of the gas line, in absolute Fahrenheit
  • P1 and P2 are the pressures at the pipe entrance and exit, in absolute psi
  • L is the length of the pipe, in miles
  • G is the relative gas density with respect to air
  • Z is the gas compressibility
  • E is the pipeline efficiency
  • Le is the effective length of the pipeline
  • Δz is the elevation of the pipe exit with respect to the entrance in feet
  • Q is the flowrate, in standard cubic feet per day
The gas compressibility Z and density are calculated at an average pressure and temperature, defined below.


The equations given above use several empirical factors, and normally the input parameters would need to be specified in specific units.  However, I've programmed the spreadsheet to handle the unit conversions for you.  You simply specify the input units using drop-down menus.

For dry gas fields, the pipeline efficiency is generally around 0.92, casing-head gas would have a pieline efficiency of 0.77, while gas and condensate pipes have an efficiency of 0.66